Page 9 - TLÜ aastaaruanne 2014
P. 9
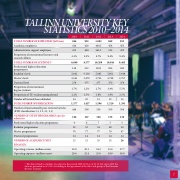
TALLINN UNIVERSITY KEY STATISTICS 2010–2014
2010 2011   2012 2013   2014
TOTAL NUMBER OF EMPLOYEES (full-time)  886 922  1,002 969 923
Academic employees
Administrative support employees  472 494  541,5 516 470
414 428 460,5 454  453
Proportion of international lecturers and research fellows
TOTAL NUMBER OF STUDENTS * Professional higher education
Bachelor’s level
Master’s level
Doctoral level
Proportion of international degree students
Proportion of TU students going abroad
Number of Doctoral theses defended
TOTAL NUMBER OF PUBLICATIONS
Number of internationally peer-reviewed articles (ETIS classification 1.1, 1.2, 2.1, 3.1)
NUMBER OF STUDY PROGRAMMES open for admission
Professional higher education programmes Bachelor programmes
Master programmes
Doctoral programmes
NUMBER OF ACADEMIC UNITS
FINANCES
Operating revenue (million euros)
Operating expenses (million euros)   29.8  32.4  35.0  39.9 39.9
* The data related to students are given for the period 2009-2012 as of 31.12, but since 2013 the data are presented as of 01.11 according to the agreement of the data task group of the Estonian Rectors’ Council.
programmes
6.6% 8.5%
8,899 9,577
138 212
5,841 6,120 2,641 2,870 279 375
1.7% 2.2%
2.2% 2.5% 14 20 1,377 1,457
448 500
146 147
4 4 52 52 76 77 14 14 25 25
8.7% 9.4% 9.4%
10,209 10,016 9,485
1191 956 692
5,885 5,901 5,648 2,756 2,789 2,767 377 370 378
2.7% 3.8% 5.5%
1.9% 1.9% 2.5% 12 23 16 1,596 1,520 1,391
550 560 564
148 138 136
7 5 5 54 49 50 77 70 67 14 14 14 26 26 26
26.9 30.3
34.2 36.8 37.7
7