Page 67 - TLÜ aastaaruanne 2014
P. 67
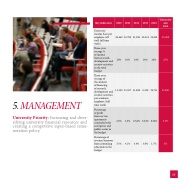
Key Indicators
University income base per employee (all staff, full time work)
Three-year average %
of income
from research, development and creative activities in the total budget
Three-year average of
the amount
of financing
of research, development and creative activities per academic employee (full time work)
Percentage
of profit
from service agreements concluded with enterprises and public sector in the budget
Percentage of revenue/turnover from continuing education in the budget
2010 2011 2012
29,440 32,790 31,598
20% 18% 18%
University 2013 2014 aim 2014
20,633 36,801
33,000
18% 24% 25%
11,300 13,027 11,499
8,339 19,711
13,000
5. MANAGEMENT
University Priority: Increasing and diver- sifying university financial resources and creating a competitive input-based remu- neration policy.
2.8% 2.5% 0.64%
3.5% 6.1% 3.6%
0.62% 0.64% 3.5%
3.9% 1.7% 5%
65