Page 73 - TLÜ aastaaruanne 2014
P. 73
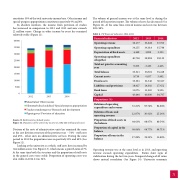
constitutes 30% of the total university income base. Other income and special-purpose appropriations constitute respectively 6% and 4%.
In absolute numbers, the income from provision of studies has increased in comparison to 2012 and 2013 and now exceeds 22 million euros. Change in other income by years has remained relatively stable (Figure 11).
The volume of general income was at the same level as during the period of the previous report. The volume of costs has decreased (See Figure 14). At the same time, ratio of income and costs was between 94%-98%.
Table 4. TU financial indicators 2012-2014
Financial indicators
Operating revenue
Operating expenditure
Depreciation of fixed assets
Operating expenditure altogether
Total net gain for accounting year
Total balance
Current assets
Fixed assets
Liabilities and provisions   19,827  18,302  17,652
40000 35000 30000 25000 20000 15000 10000
5000 0
2012
50,177 36,255 4,449
40,704
9,363
2013
36,849 36,018 3,900
39,908
-3,185
2014
37,705 35,799 3,333
39,132
-1,426
63,311 9,730 53,581
58,601 6,057 52,545
56,419 5,892 50,527
Bank loans
11,076
11,282
9,526
2012
2013 2014
Capital  43,484  40,300  38,767
Muud tulud/ Other income
Sihtotstarbelised eraldised/ Special-purpose appropriations Teadus-arendustegevus/ Research and development Õppetegevus/ Provision of education
Proportions (%)
Relation of operating expenditure and revenue
Relation of loans and operating revenue
Proportion of fixed assets in the balance
Proportion of capital in the balance
Proportion of loans in the balance
72.25% 22.07% 84.63% 68.68% 17.49%
97.74% 30.62% 89.67% 68.77% 19.25%
94.94% 25.26% 89.56% 68.71% 16.88%
Joonis 11. Keskteenistuse kulude jaotus
Figure 11. Dynamics of the university income in 2102-2014 (thousand euros)
Division of the costs of administrative units has remained the same as the cost division structure of the previous year – 54% - staff costs and 46% - other costs on administrative services. During the same period in 2013 the proportions were respectively 52% and 48% (See Figure 12).
Looking at the university as a whole, staff costs have increased by two million euros (See Figure 13), which means a growth ratio of 7%. At the same time both the structure and the proportion of staff costs
in the general costs were stable. Proportion of operating costs was also stable; in 2014 it was 34%.
Operating revenue was at the same level as in 2013, and operating revenue exceeds operating expenditure. Ratios show signs of stabilisation during the last two years. Temporal change of all ratios shows mutual correlation (See Figure 16). University economic
71