Page 75 - TLÜ aastaaruanne 2014
P. 75
activity is positive. The loss was caused by depreciation of fixed assets, which is related to the development of the university in 2010-2012 and the increase in the volume of fixed assets. At the end of 2012, two new buildings – the Nova building and Astra building, were ready for occupancy. The volume of fixed assets in residual value increased from 35,699,000 euros in 2010 to 53,581,000 euros in 2012. Improvements to the study environment of the TU Pedagogical Seminar ended in 2014, and from this fixed assets increased by 935,000 euros. At the same time the university has started transferring property that is not used.
5.2.1 FINANCINGOFTEACHINGANDLEARNING
Due to the reforms in higher education in 2013, the proportion of paid study service decreases year by year. The objective is to improve the quality of higher education and offer an opportunity to acquire free higher education to students. Compared to 2013, the financing scheme of activity support allocated by the Ministry of Education and Research has changed. In 2014 and 2015, it is no longer possible to take into account the number of students admitted to non-state funded student places in the previous three years or the last year. Consequently, there will be a transition to a new activity support and indicator-based calculation in order to compensate for the decrease in tuition-based studies. In addition to the number of admitted students, the numbers of graduated students in 2014 have also been included in the indicators used in calculating financing.
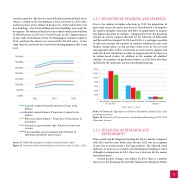
350,00% 300,00% 250,00% 200,00% 150,00% 100,00%
50,00% 0,00%
2012 2013 2014
Laenude osakaal bilansis/Proportion of loans in the balance
Kapitali osakaal bilansis/ Proportion of capital in the balance
Põhivara osakaal bilansis/ Proportion of fixed assets in the balance
Laenude ja tegevustulude suhe/ Relation of loans and revenue
Tegevuskulude ja tegevustulude suhe/ Relation of operating expenditure and revenue)
14 000 12 000 10 000
8 000 6 000 4 000 2 000
0
Kõrghariduse tegevustoetus/ Tasuline õpe/ NSC education Täiendkoolitus/ Continuing
SC education education
2012 2013 2014
Joonis 15. Ülikooli finantstegevuse suhtarvud aastatel 2012–2014
Figure 15. Proportion of the university financial activity ratios in 2012 – 2014
Joonis 16. Joonis 16. Õppetegevuse tulubaasi dünaamika aastatel 2012–2014 (tuhandetes eurodes)
Figure 16. Dynamics of the income base of teaching and learning in 2012- 2014 (thousands of euros)
5.2.2 FINANCINGOFRESEARCHAND DEVELOPMENT
The research and development funding for 2014 is mainly compared with 2012 and the years before that, because 2013 was an exception- al year due to income from a few large projects. The adjusted trend indicates an increase in research and development funding in 2014, although in comparison to 2013, there was a decrease for the reason mentioned above.
Several positive changes are evident. In 2014, there is a notable increase in the financing of externally funded non-European Union
73