Research in figures
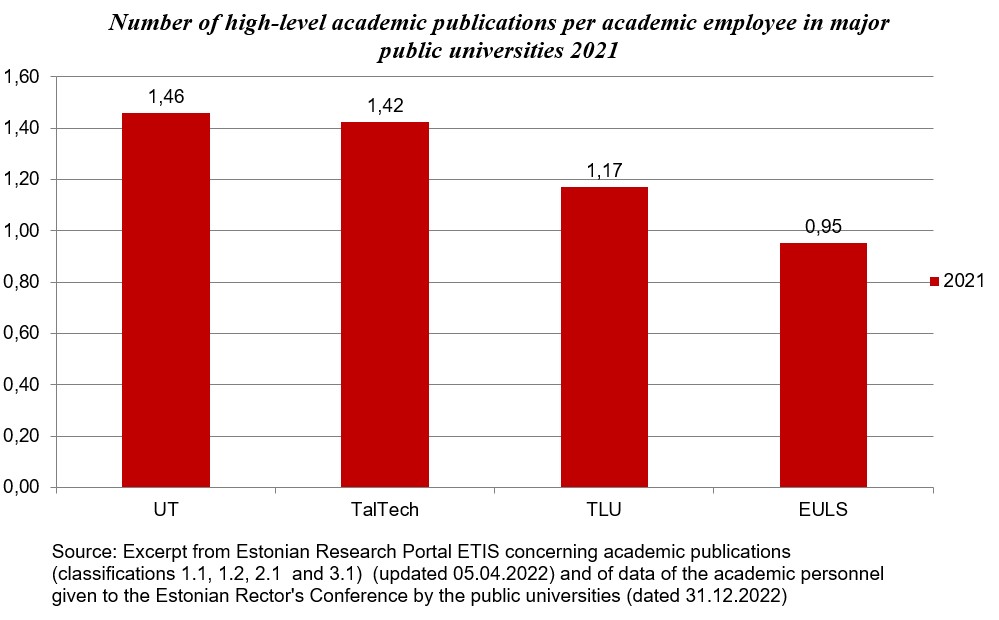
High-level academic publications (Estonian Research Portal ETIS' classifications 1.1, 1.2, 2.1 ja 3.1)
| 2016 | 2017 | 2018 | 2019 | 2020 | 2021 | 2022 | |
|---|---|---|---|---|---|---|---|
| Total TLU | 513 | 51 | 388 | 462 | 502 | 536 | 510 |
| Number per academic employee | 1,25 | 1,30 | 0,99 | 1,18 | 1,15 | 1,17 | 1,10 |
Source: Excerpt from Tallinn University's activity reporting environment concerning academic publications (classifications 1.1, 1.2, 2.1 ja 3.1)
Selected RD key indicators of Tallinn University development plans 2015-2020, 2020-2021
| 2017 | 2018 | 2019 | 2020 | 2021 | 2022 | |
|---|---|---|---|---|---|---|
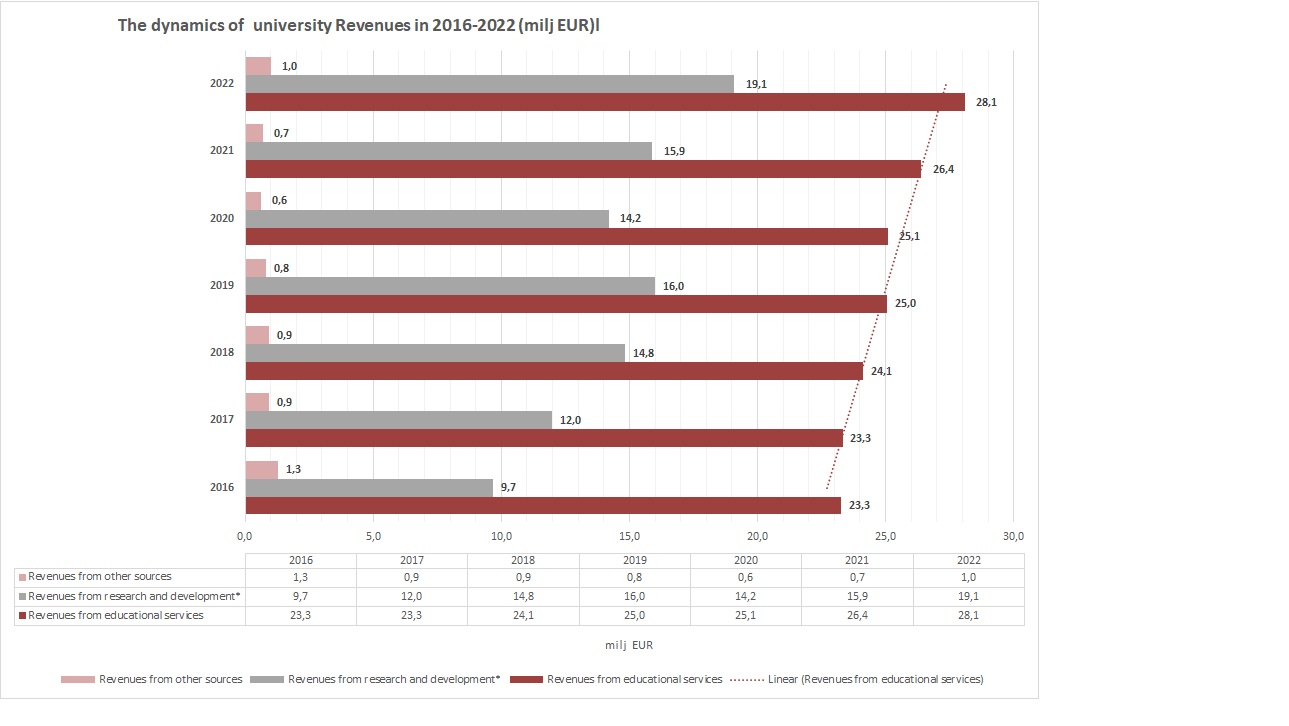
| The proportion of interdisciplinary research projects and research development services in the university revenue (%) | 69,36 | 72,74 | 77,79 | 72,63 | 71,27 | 73,03 |
| The funding of international research projects in the income of research, development and creative activity (M euros) | 3,06 | 3,39 | 2,86 | 2,84 | 4,18 | 5,30 |
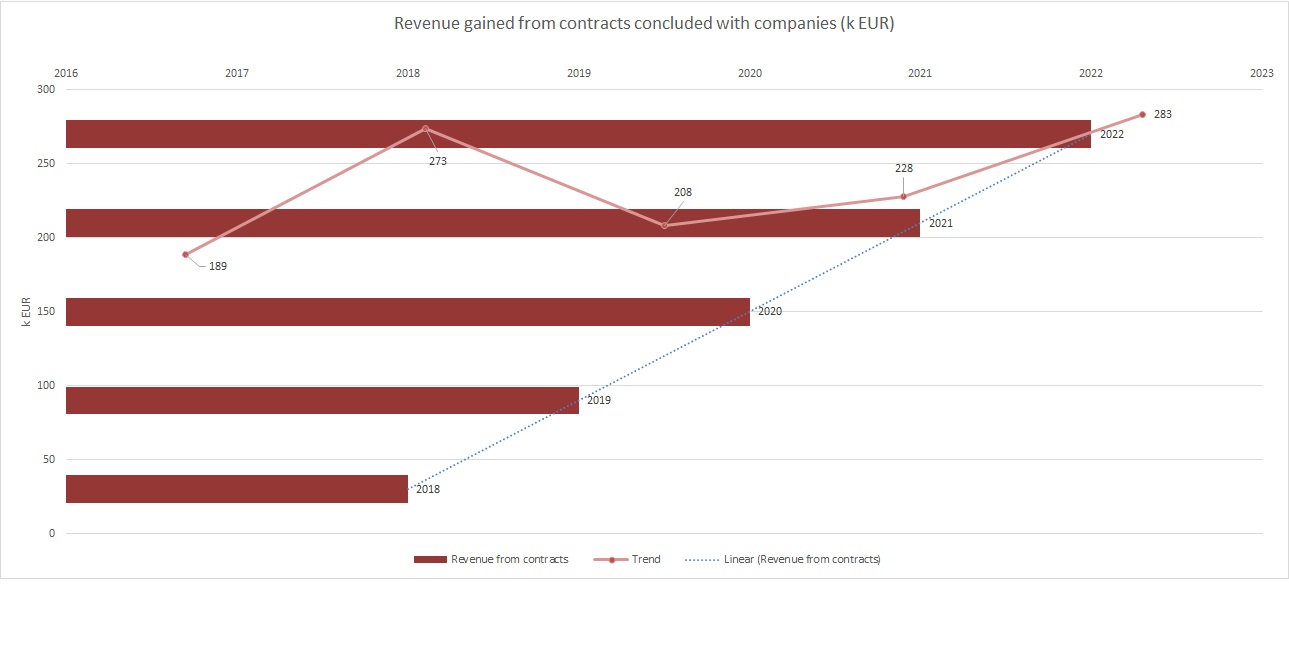
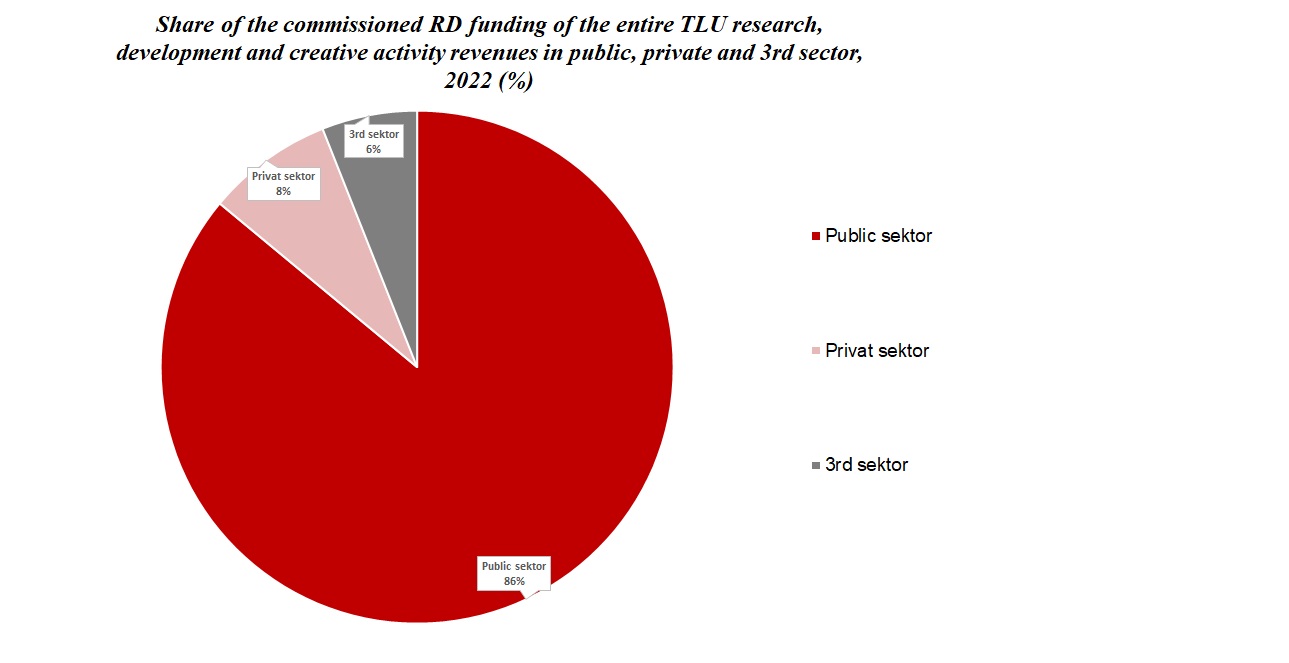
| The proportion of commissioned RD funding of the entire research, development and creative activity funding (%) | 6,71 | 12,33 | 11,60 | 6,47 | 9,97 | 5,29 |
| The three-year average funding of research related research, development and creative activity per academic employee (euros) | 16955 | 24195 | 29926 | 31598 | 31041 | 30820 |
| The number of doctoral theses defended | 25 | 22 | 20 | 22 | 26 | 18 |
Foreign academic staff
| 2016 | 2017 | 2018 | 2019 | 2020 | 2021 | 2022 | |
|---|---|---|---|---|---|---|---|
| Number of FTE (full time equivalent) foreign academic staff | 46 | 42 | 49 | 51 | 67 | 76 | 83 |
| Percentage (%) of foreign academic staff | 11,3 | 10,7 | 12,4 | 13,1 | 15,3 | 16,69 | 18,01 |